

SLIDE 1 OF 22
Retirement living conjures up various images. Some see retirement living as traveling. Others envision more family time. Still others simply look forward to more free time.
No matter what your view, there are a number of questions and concerns that should be addressed to help you better prepare for retirement living. Because in order to pursue your goals and dreams for retirement, it is necessary to determine a strategy for your future. Otherwise, your choices may be limited and your options few.

SLIDE 2 OF 22
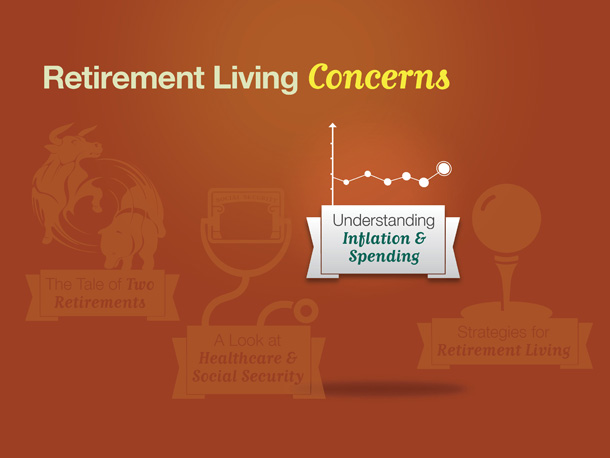
We’re going to take a closer look at four aspects of retirement living during the course of this presentation.
The first item we are going to review is called “The Tale of Two Retirements.”
The second is “A Look at Healthcare and Social Security.”
Next, “Understanding Inflation and Spending.”
And finally, “Strategies for Retirement Living.”

SLIDE 3 OF 22
Let’s get right into our first section “The Tale of Two Retirements.”
SLIDE 4 OF 22
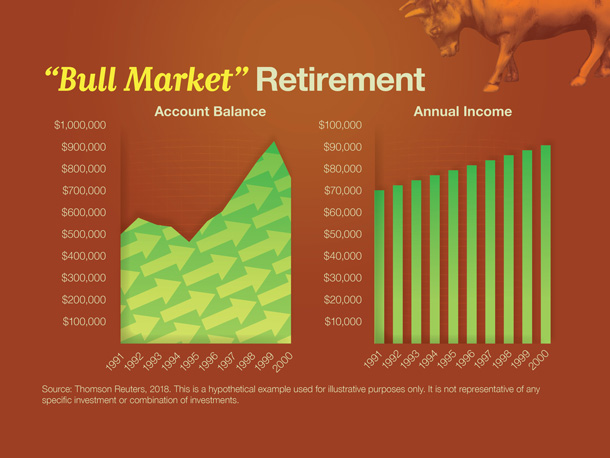
The timing of your retirement can potentially make a difference in your retirement living. In this example, let’s take a look at what we’re going to call a “bull market” retirement. In this instance, a hypothetical couple retired on January 1, 1991, with a retirement savings of $500,000. They decided to invest their entire portfolio in a group of securities that closely resembled the Standard & Poor’s 500 Composite Index, which is generally considered representative of the U.S. stock market. They also decided to withdraw $70,000 from their account at the end of the first year and increase their annual withdrawals by 3% to account for inflation. The chart on the left shows that, despite their withdrawals, their account balance rose to nearly $770,000 by December 31, 2000. At the same time, the couple withdrew a total of $802,000 in annual income from the account during the 10-year period.
This a hypothetical example used for illustrative purposes only. It is not representative of any specific investment or combination of investments. Generally, retirement-aged couples may want to hold a diversified portfolio of investments rather than commit their entire portfolio to the U.S. stock market. Keep in mind that the return and principal value of stock prices will fluctuate as market conditions change. And shares, when sold, may be worth more or less than their original cost. Also, diversification is an approach to help manage investment risk. It does not eliminate the risk of loss if security prices decline. Stocks are represented by the S&P 500 Composite Index (total return), an unmanaged index that is generally considered representative of the U.S. stock market, for the period January 1, 1991, though December 31, 2000. Past performance does not guarantee future results. Individuals cannot invest directly in an index.
Source: Thomson Reuters, 2018
SLIDE 5 OF 22
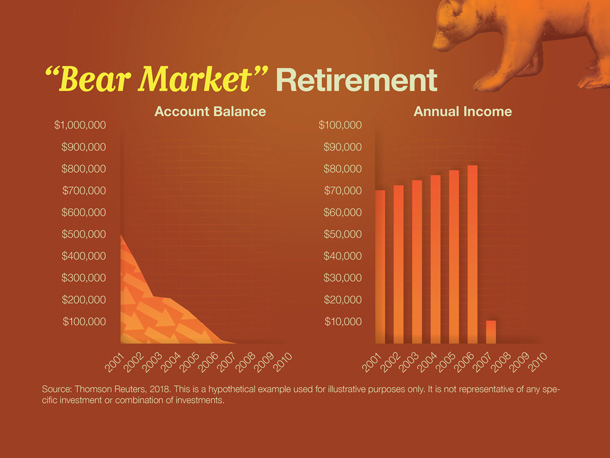
What could happen if a couple retires during turbulent times? In this example, let’s take a look at what we’re going to call a “bear market” retirement. In this instance, a hypothetical couple retired on January 1, 2001, with a retirement portfolio of $500,000. They decided to invest their entire portfolio in a group of securities that closely resembled the S&P 500 Composite Index, which is generally considered representative of the U.S. stock market. They decided to withdraw $70,000 from their account at the end of the first year and wanted to increase their withdrawals by 3% annually to account for inflation. But that strategy didn’t work for long. As the chart on the left shows, the couple’s account balance hit zero in 2007. During the seven years, the couple’s portfolio generated roughly $460,000 in annual income. In this instance, the couple may have benefited from a more diversified portfolio of investments. Keep in mind, however, that diversification is an approach to help manage investment risk. It does not eliminate the risk of loss if security prices decline.
This a hypothetical example used for illustrative purposes only. It is not representative of any specific investment or combination of investments. Their portfolio is represented by the S&P 500 Composite Index (total return), an unmanaged index that is generally considered representative of the U.S. stock market, for the period January 1, 2001, though December 31, 2010. The return and principal value of stock prices will fluctuate as market conditions change. And shares, when sold, may be worth more or less than their original cost. Past performance does not guarantee future results. Individuals cannot invest directly in an index.
Source: Thomson Reuters, 2018

SLIDE 6 OF 22
The next section we’re going to explore is called “A Look at Healthcare and Social Security.”

SLIDE 7 OF 22
When preparing for retirement, one of the first questions you should ask yourself is, “How much will it cost?”
The answer may depend on two main factors: How much you want to spend during retirement and how long you expect to live. While some are skilled at understanding spending, they may be less knowledgeable about how long they are expected to live. A landmark study found that 43% of adults underestimate the average life expectancy by about five years. Put another way, most adults actually think they’re going to die younger than the statistics indicate.
The average person’s life expectancy at age 65 is 84.3 for men and 86.7 for women. And 25% of people who reach age 65 will live past age 90. A full 10% will live past age 95.
Have you estimated your life expectancy? Have you weighed your life expectancy against your total retirement assets?
Sources: Social Security Administration, 2018; CNBC, January 13, 2018

SLIDE 8 OF 22
When it comes to retirement living, increasing healthcare costs are a concern for the majority of people. Many may no longer be covered by their former employer’s healthcare and are tasked with purchasing insurance on their own. Still others are expected to learn about the benefits and limitations of Medicare.
One survey found that 44% of retirees say their healthcare costs are higher than they expected. Creating a sound retirement plan can help you deal with unforeseen expenses.
Source: Employee Benefit Research Institute (EBRI), 2018

SLIDE 9 OF 22
The Centers for Medicare & Medicaid Services track the total amount spent by Americans on healthcare. This chart shows that costs have risen steadily during the past 20 years—from just over $1 trillion in 1995 to $3.5 trillion in 2017 (the latest year for which data is available).
To put overall healthcare costs in better perspective, this chart compares the cost of healthcare with the Consumer Price Index (CPI), the federal government’s measure of changes in the price level of consumer goods and services purchased by households. The green line plots what $1 trillion would have risen to if healthcare costs had risen at the same rate as the CPI. The purple line shows the actual rise in healthcare costs.
Will the current trend of rising healthcare costs continue in the future? No one knows for certain. But for many, the best course may be to appropriately budget for healthcare costs in retirement.
Sources: Centers for Medicare & Medicaid Services, 2018; Thomson Reuters, 2018
SLIDE 10 OF 22
The third area we are going to touch on is called “Understanding Inflation and Spending.”
SLIDE 11 OF 22
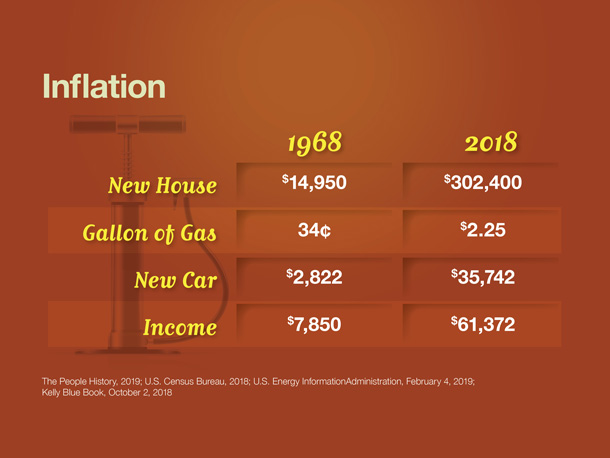
Inflation is another concern as you consider retirement living. Inflation occurs when there is a general increase in the prices of goods and services. When the general price level rises, each dollar buys less. As such, many economists say that inflation erodes the purchasing power of money. Here’s a quick snapshot of prices during a 50-year period.
In 1968, the median price of a new house was $14,950. At the end of 2018, it was $302,400.
The cost of a gallon of gasoline has gone up significantly, from 34 cents in 1968, to $2.25 at the end of 2018.
And the price of a new car has risen from $2,822 in 1968 to $35,742 at the end of 2018.
Over the same period, income has risen from $7,850 in 1968, to $61,372 in 2018. As you can see, the average income didn’t rise as quickly as the cost of the new house, gallon of gas, or the new car.
Seeing a long-term trend in consumer prices may help you better estimate how much money you can expect to need during retirement.
Sources: The People History, 2019; U.S. Census Bureau, 2019; U.S. Energy Information Administration, February 4, 2019; Kelly Blue Book, October 2, 2018
SLIDE 12 OF 22
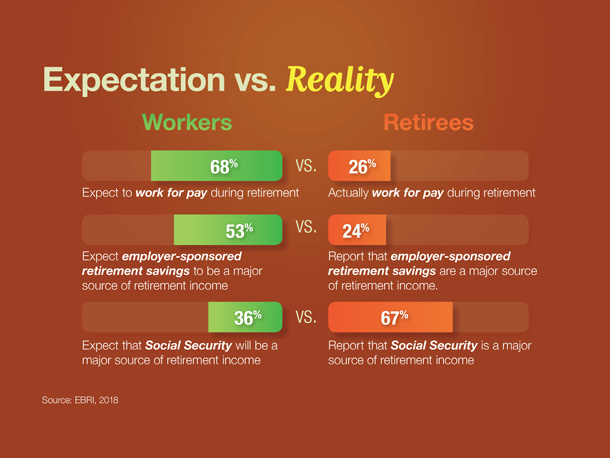
One survey has found there is a disconnect between the expectations of workers and the reality reported by those who have actually retired.
For example, 68% of workers surveyed expect to continue working for pay during retirement. In contrast, 26% of retirees actually do continue working for pay.
Fifty-three percent of workers expect employer-sponsored retirement savings plans to be a major source of retirement income; 24% of retirees report that employer-sponsored retirement savings plans are a major source of retirement income.
And interestingly, only 36% of workers expect Social Security to be a major source of retirement income, while 67% of retirees reported that Social Security actually is a major source of retirement income.
When preparing for retirement, it’s critical to form realistic expectations.
Source: EBRI, 2018
SLIDE 13 OF 22
Some aspects of retirement are beyond our control: inflation and healthcare costs, for example. Some are not.
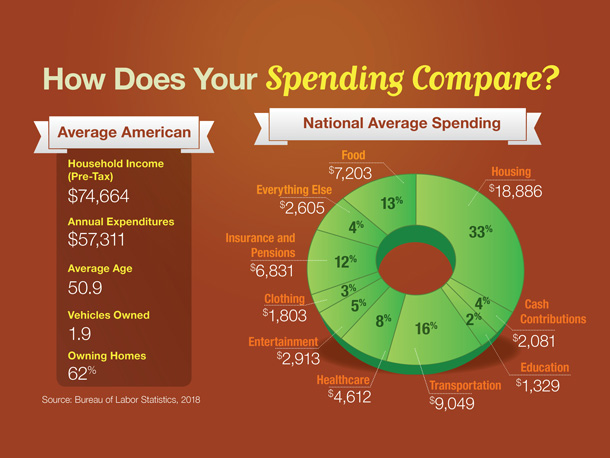
A good first step in preparing for retirement is to understand your spending patterns and identify what you are spending money on.
The Bureau of Labor Statistics collects information on the nation’s spending, which can help serve as a benchmark. Their research shows that, for American families, the biggest share—33%—of the average household budget goes for housing. Transportation takes 16% and food 13%.
How does your spending pattern compare with the national averages? How much money are you setting aside for retirement? If one or two of your numbers is out of line, make a note, and we can discuss it during your complimentary consultation.
Source: Bureau of Labor Statistics, 2018
SLIDE 14 OF 22
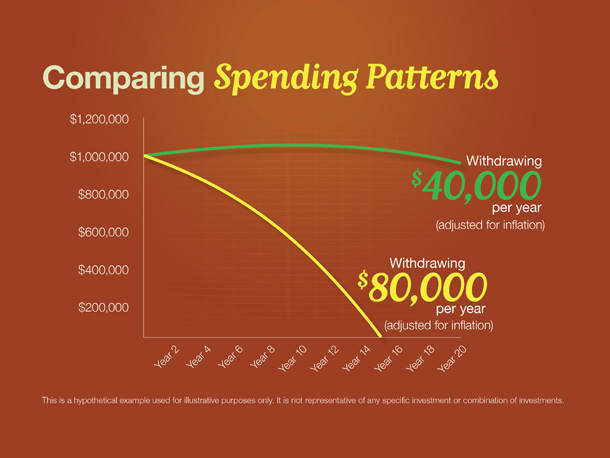
Another insightful exercise is to see how your spending pattern may affect your retirement money.
This illustration shows a $1 million account earning a hypothetical 5% a year.
Withdrawing $80,000 a year from this account—with withdrawals increasing by 3% a year to account for inflation—is projected to exhaust the account in 15 years.
If each annual withdrawal is reduced to $40,000—with withdrawals increasing by 3% a year for inflation—the account is projected to have more than $950,000 after 20 years.
The point of this exercise is to show how withdrawal rates can influence account balances. There are years when you can expect to spend more money and years when you may spend less. The important take-away message is preparation. The better you understand how money works, the better you may be able to prepare for retirement.
This is a hypothetical example used for illustrative purposes only. It is not representative of any specific investment or combination of investments.

SLIDE 15 OF 22
The final topic we are going to review is called “Strategies for Retirement Living.”
SLIDE 16 OF 22
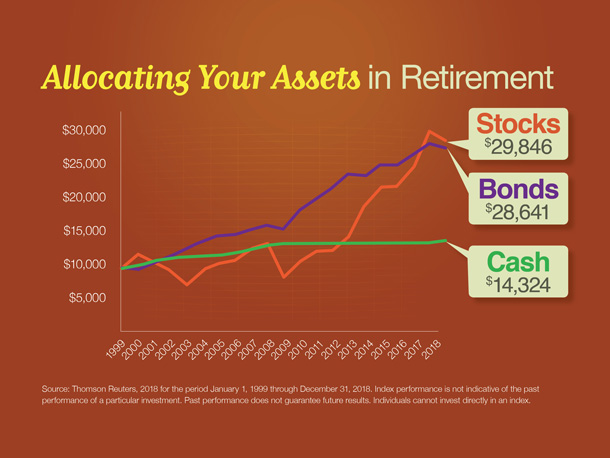
At any time, allocating your assets among investment choices is a strategy to consider. When you are evaluating retirement, asset allocation has an even higher sense of urgency. Remember, however, that asset allocation is an approach to help manage investment risk. Asset allocation does not guarantee against investment loss. Let’s take a closer look at the long-term performance of three major asset classes: cash alternatives, bonds, and stocks. As the illustration shows, over the 20-year period, stocks were the best performing asset class. As you can see, stocks were the best performer. However, stock prices were volatile over that period of time, which may not appeal to investors with a lower risk tolerance. Cash alternatives had a steady return over the 20 years but underperformed the other two asset classes. Conservative investors who kept all their assets in cash alternatives didn’t experience the market volatility but also realized a lower return and may have lost purchasing power due to inflation.
Stocks are represented by the Standard & Poor’s 500 Composite Index (total return), an unmanaged index that is generally considered representative of the U.S. stock market. Bonds are represented by the Citigroup Corporate Bond Composite Index, an unmanaged index that is generally considered representative of the U.S. bond market. Cash is represented by the Citigroup 3-Month Treasury Bill Index, an unmanaged index that is generally considered representative of short-term cash alternatives. U.S. Treasury bills are guaranteed by the federal government as to the timely payment of principal and interest. However, if you sell a Treasury bill prior to maturity, it could be worth more or less that the original price paid. Index performance is not indicative of the past performance of a particular investment. Past performance does not guarantee future results. Individuals cannot invest directly in an index. The rate of return on investments will vary over time, particularly for longer-term investments. Investments that offer the potential for high returns also carry a high degree of risk. Actual returns will fluctuate.
Source: Thomson Reuters, 2019. For the period January 1, 1999, through December 31, 2018
SLIDE 17 OF 22
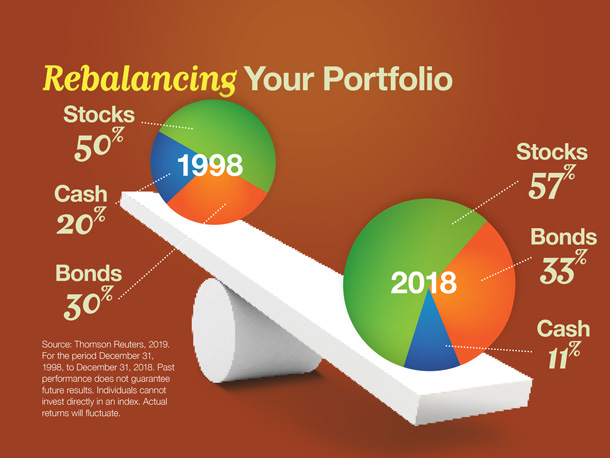
Rebalancing is not a one-time event. It’s an ongoing process. That’s because time can change your asset allocation without you realizing it. If overlooked for a period of time, a portfolio may take on a completely different degree of risk.
For example, consider a hypothetical portfolio started December 31, 1998, with a balance of 20% cash, 3-% bonds, and 50% stocks. What would the portfolio look like on December 31, 2018?
It would have shifted to 11% cash, 33% bonds and 57% stocks. That’s more aggressive than the original intent, and that’s where rebalancing comes in. Periodically rebalancing your portfolio may help it continue to reflect your intent and risk tolerance.
Stocks are represented by the Standard & Poor’s 500 Composite Index (total return), an unmanaged index that is generally considered representative of the U.S. stock market. Bonds are represented by the Citigroup Corporate Bond Composite Index, an unmanaged index that is generally considered representative of the U.S. bond market. Cash is represented by the Citigroup 3-Month Treasury-Bill Index, an unmanaged index that is generally considered representative of U.S. cash market. Index performance is not indicative of the past performance of a particular investment. Past performance does not guarantee future results. Individuals cannot invest directly in an index.

SLIDE 18 OF 22
If you were to map out your holdings on a pie chart, what would your investment mix look like? Where is your money invested right now?
Make sure you account for all your investments. That would include your rainy-day funds, the money set aside for retirement, everything.
Many find this exercise to be a bit difficult. They’ve never thought about how all their investments work together—let alone whether their approach is consistent with their investment objectives, tolerance for risk, and time frame.
Yet it can be critical. If you don’t know where you are, how can you map a path to where you’d like to be?

SLIDE 19 OF 22
At retirement, our growth investment plans become income investment plans. What happens when a growth plan becomes an income plan?
As the illustration shows, a $500,000 growth portfolio generating a hypothetical 6% annual rate of return grew to nearly $1.2 million after 15 years.
How much income could $1.2 million potentially generate?
Assuming the individual began investing at age 52, by the time the account holder reaches 67, the portfolio could generate $50,000 in income. In subsequent years, assuming the portfolio continued to generate a hypothetical 4% annual rate of return, the account holder’s income could increase by 3% each year. For example, when the account holder reaches 68, the portfolio could generate $51,500.
After 23 years, at age 90, the account holder’s annual income would have increased to nearly $100,000. A total of $1.7 million would have been taken in income. And an additional $425,000 would remain for heirs.
This is a hypothetical example used for illustrative purposes only. It is not representative of any specific investment or combination of investments.
SLIDE 20 OF 22
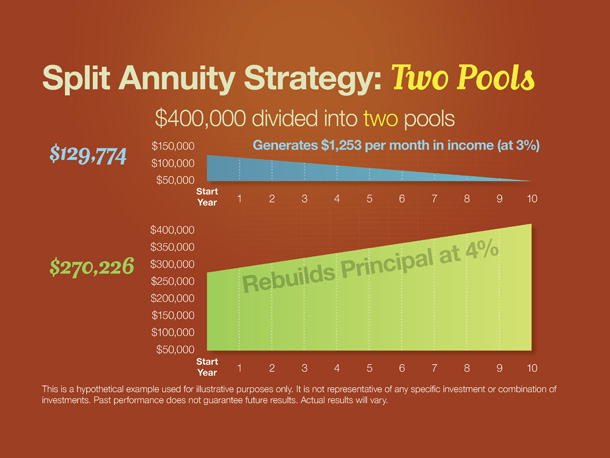
There are some creative and potentially effective ways to take income from your retirement accounts. One approach uses two different annuity contracts to generate income and rebuild principal. Under this approach, a retiree divides $400,000 between an immediate fixed annuity and a single-premium deferred annuity. Assuming a hypothetical 3% return on the immediate annuity, a hypothetical 4% return on the deferred annuity, and a 10-year contract, the immediate annuity would generate a hypothetical $1,253 per month in income. Over the same 10-year period, the deferred annuity would grow to $400,000—effectively replacing the principal. A split annuity strategy can help you generate current income while pursuing a future income stream. Remember, the interest portion of the immediate fixed annuity is subject to taxes. You also will have to pay taxes on the growth of the single-premium deferred annuity.
The guarantees of an annuity contract depend on the issuing company’s claims-paying ability. Annuities have contract limitations, fees, and charges, including account and administrative fees, underlying investment management fees, mortality and expense fees, and charges for optional benefits. Most annuities have surrender fees that are usually highest if you take out the money in the initial years of the annuity contact. Withdrawals and income payments are taxed as ordinary income. If a withdrawal is made prior to age 59½, a 10% federal income tax penalty may apply (unless an exception applies). Annuities are not guaranteed by the FDIC or any other government agency. This is a hypothetical example used for illustrative purposes only. It is not representative of any specific investment or combination of investments. Past performance does not guarantee future results. Actual results will vary.
SLIDE 21 OF 22
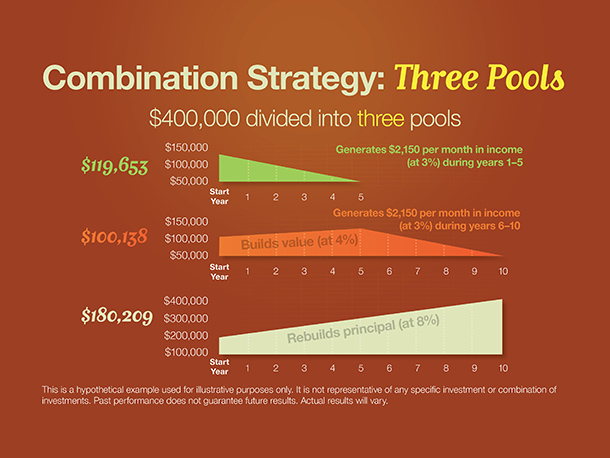
Another somewhat more complex and aggressive strategy involves dividing your money into three pools. The first pool is dedicated to income, the second to safety, and the third to growth. This shifts most investment risk to the third pool. It also means the third pool has the greatest potential for growth. Retirees gradually spend down the first two relatively conservative pools, giving the third more time to grow.
In this hypothetical example, the first pool is invested in an immediate fixed annuity and would generate $2,150 per month in income during years 1 through 5. The second pool is invested in conservative investments generating an average annual return of 4%. Its objective is to replace the original five-year immediate annuity. During years 6 through 10, the second pool also would generate $2,150 per month in income. At the same time, the third pool is invested for growth to take advantage of potentially higher returns.
Keep in mind that with the potential for higher returns comes an increased level of investment risk. If the strategy is successful, the investment would rebuild the $400,000 principal, and the process could start over again. In contrast to the split annuity strategy, this approach depends on relatively aggressive investment of the third pool to succeed. You should consider carefully whether aggressive investing fits with your tolerance for investment risk.
This is a hypothetical example used for illustrative purposes only. It is not representative of any specific investment or combination of investments. Past performance does not guarantee future results. Actual results will vary. The guarantees of an annuity contract depend on the issuing company’s claims-paying ability. Annuities have contract limitations, fees, and charges, including account and administrative fees, underlying investment management fees, mortality and expense fees, and charges for optional benefits. Most annuities have surrender fees that are usually highest if you take out the money in the initial years of the annuity contact. Withdrawals and income payments are taxed as ordinary income. If a withdrawal is made prior to age 59½, a 10% federal income tax penalty may apply (unless an exception applies). Annuities are not guaranteed by the FDIC or any other government agency.

SLIDE 22 OF 22
When it comes to retirement living, there are many factors and considerations that need to be addressed.
Here are some questions that arise as people prepare for retirement:
Anthony and Selena have a number of grown children and wonder, “Are there ways to fund our retirement and still leave something for our children?”
Dave and Christine ask, “How can we make sure our perception matches reality?”
Rebecca is a single woman with a small business. She wants to know, “What steps do I take in order to review all my retirement assets?”
Isaac likes to do research online. He asks, “What type of investments can potentially generate income in retirement?”
Answers will depend on each unique situation and can be addressed during a complimentary consultation.